Insights Data & Reporting
Insights data merges page view and demographic data with sales and conversions to give you the most comprehensive look at your customers. This data is pulled from Google Analytics data.
Insights Data
To view insights data, go to "Insights" under "Dashboards & Reports" from the event left navigation menu.
Insights data is filtered by date range and includes:
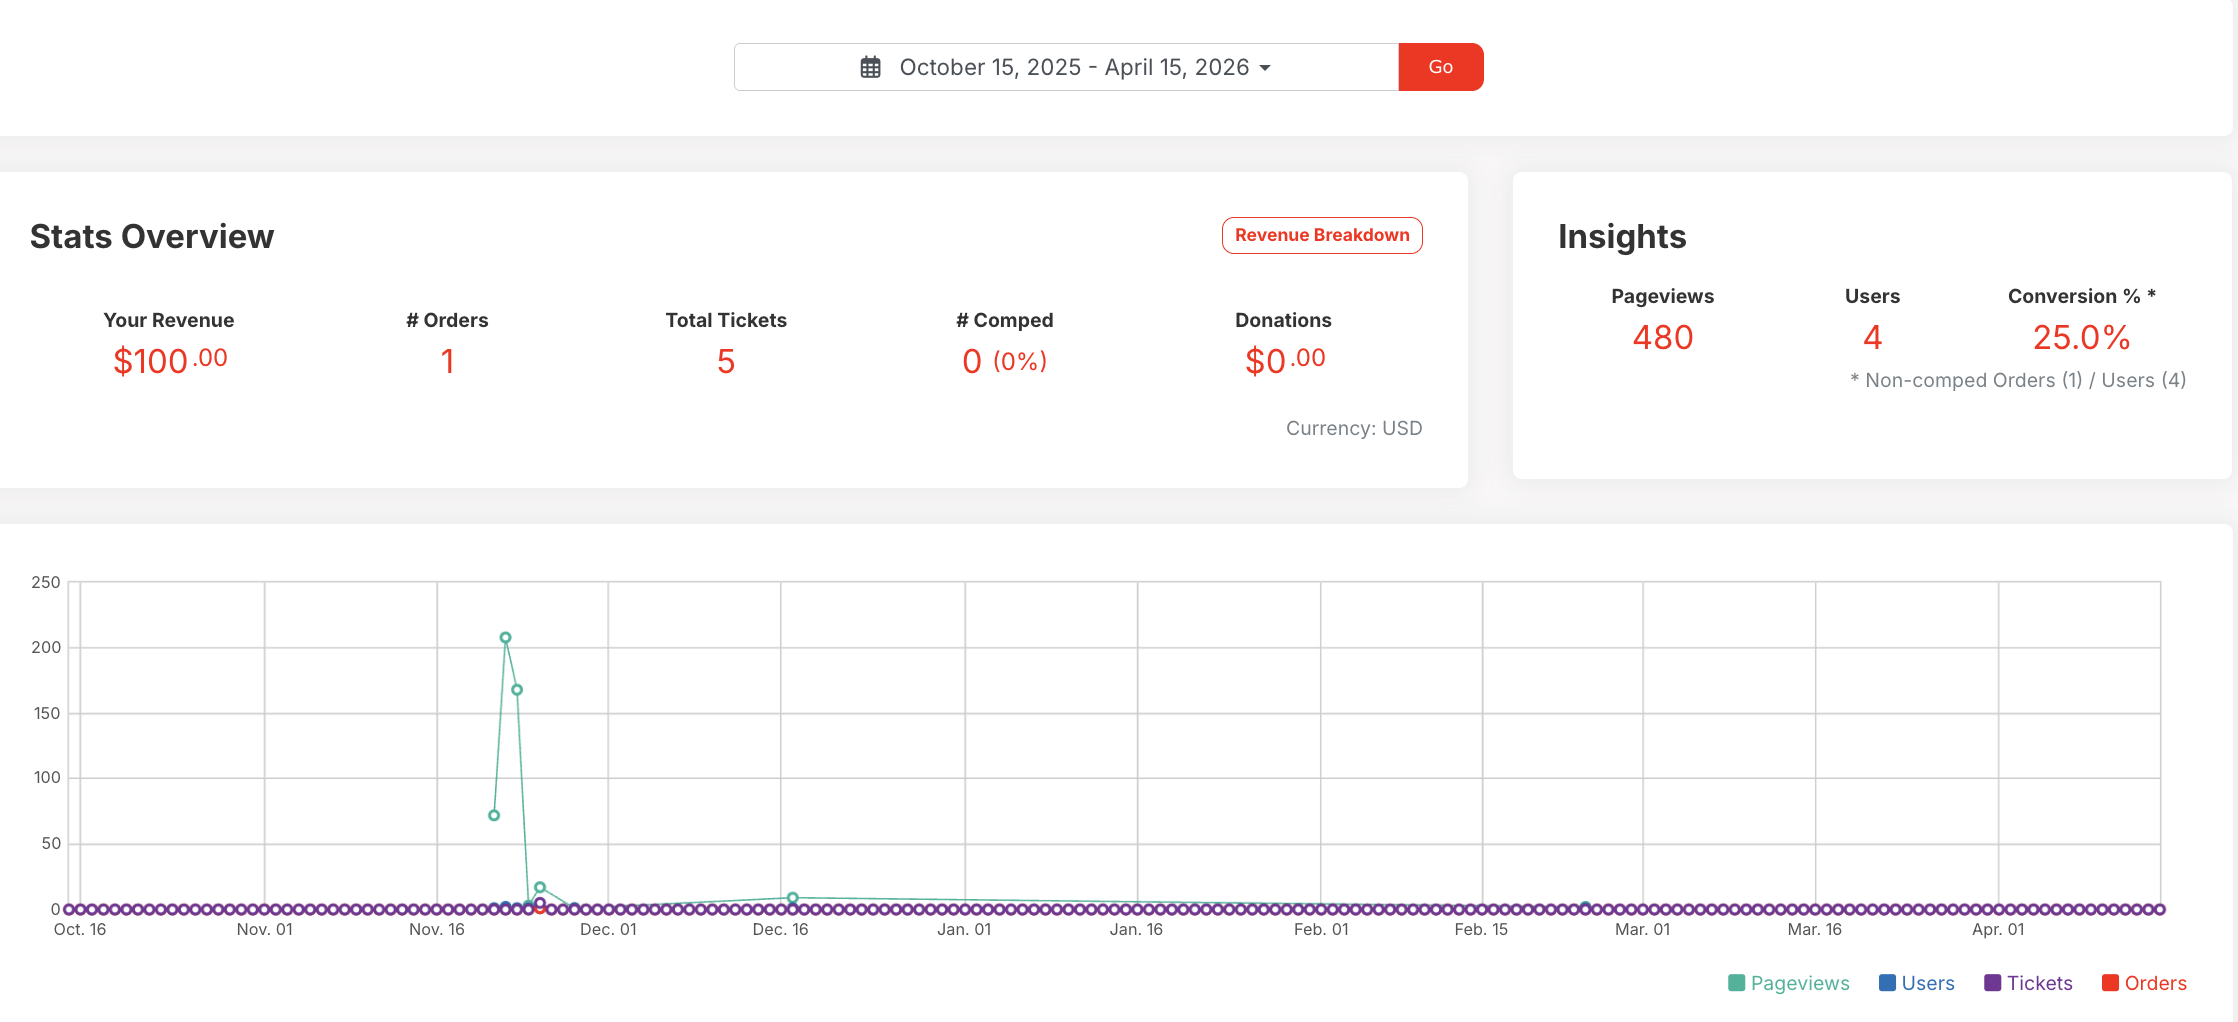
- Stats Overview & Breakdown: Sales information about your event for the given time period
- Insights: A breakdown of page views, total users, and conversion % rate (non comped orders / unique users).
- "Total users" is the total # of people who viewed your event page in the specified date range.
- Note: 1 user can view your page 10 times which is why Page Views & Users can differ.
- "Total users" is the total # of people who viewed your event page in the specified date range.
- Graph Breakdown: A chart of page views, unique page views, # of tickets, # of orders
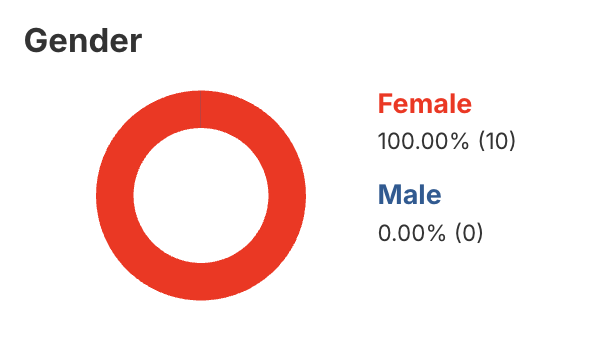
- Gender: General breakdown of gender stats for your page views
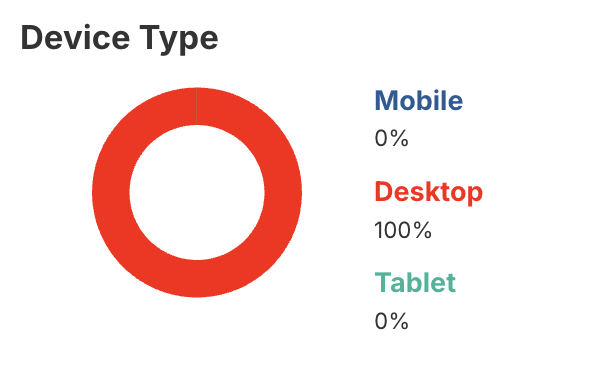
- Device type: General breakdown of device type when viewing event pages
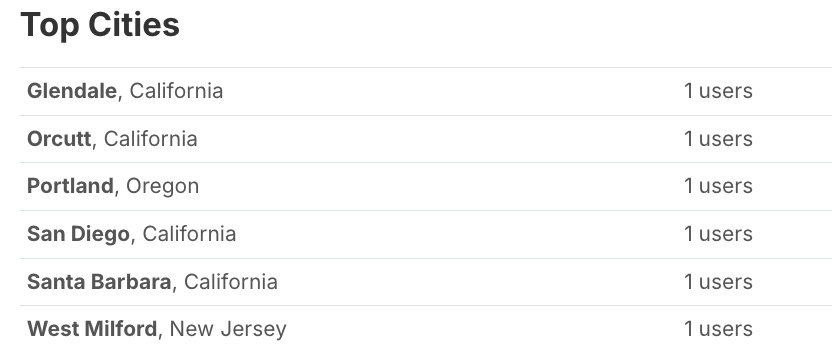
- Top Cities: The top cities where users are viewing your event pages
- Age Demographics: A breakdown of gender for each age range